চিত্র:Temp-sunspot-co2.svg

এই SVG ফাইলের জন্য এই PNG প্রাকদর্শনের আকার: ৭২০ × ৫৪০ পিক্সেল। অন্যান্য আকারসমূহ: ৩২০ × ২৪০ পিক্সেল | ৬৪০ × ৪৮০ পিক্সেল | ১,০২৪ × ৭৬৮ পিক্সেল | ১,২৮০ × ৯৬০ পিক্সেল | ২,৫৬০ × ১,৯২০ পিক্সেল।
পূর্ণ রেজোলিউশন (এসভিজি ফাইল, সাধারণত ৭২০ × ৫৪০ পিক্সেল, ফাইলের আকার: ৯৮ কিলোবাইট)
| এই ফাইলটি উইকিমিডিয়া কমন্স থেকে নেওয়া। সেখানের বর্ণনা পাতার বিস্তারিত নিম্নে দেখানো হলো। (সম্পাদনা)
|
সারাংশ
| বিবরণ |
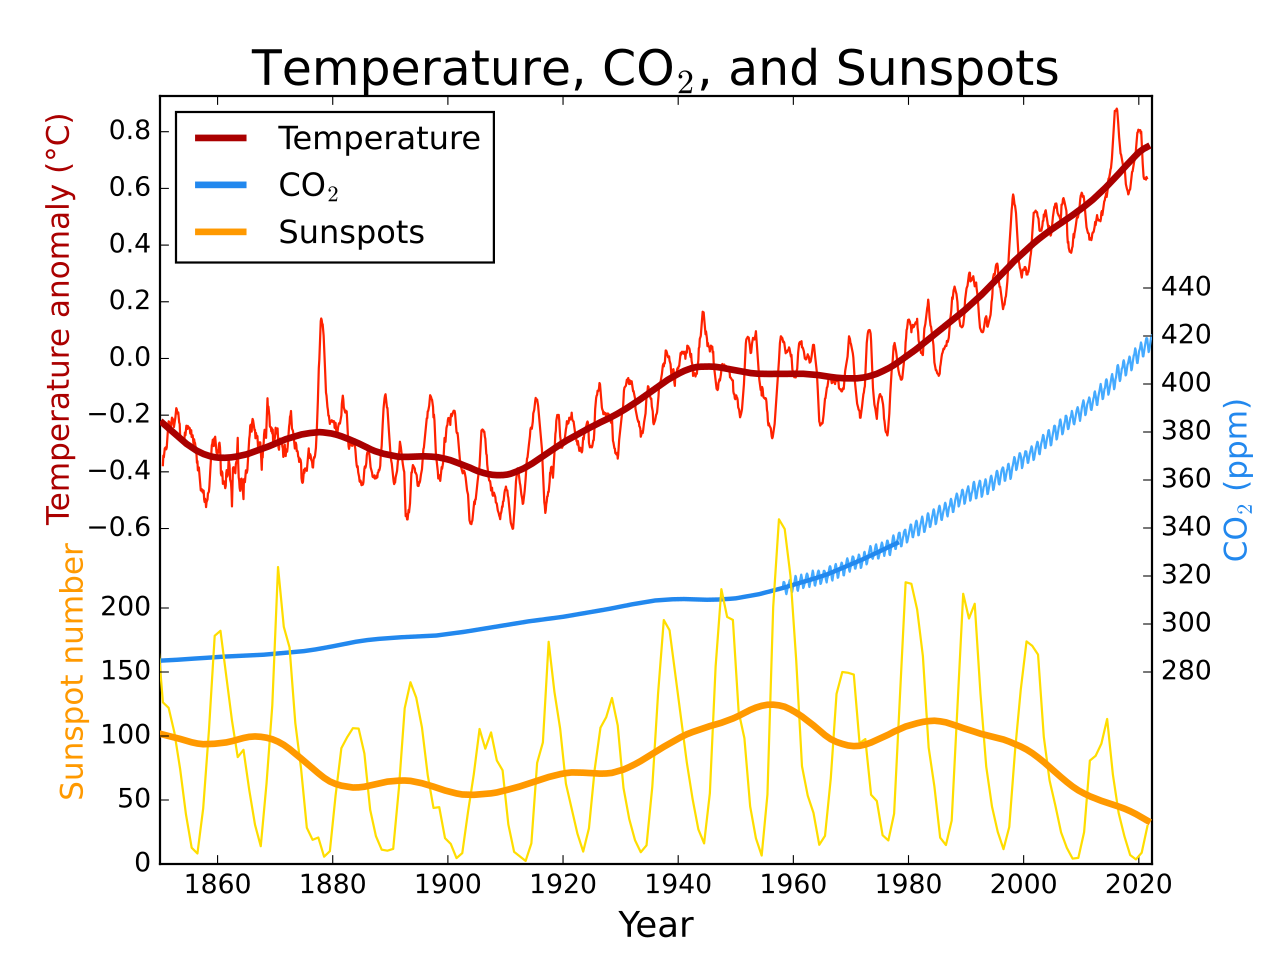
English: Global average temperature, atmospheric CO2, and sunspot activity since 1850. Thick lines for temperature and sunspots represent a 25 year LOWESS and moving average smoothing of the raw data. |
||
| তারিখ | ১১ জানুয়ারি ২০০৯ (মূল আপলোডের তারিখ) | ||
| উৎস | en.wikipedia থেকে কমন্সে স্থানান্তরিত করা হয়েছে Anrie কর্তৃক CommonsHelper ব্যবহার করে। | ||
| লেখক | ইংরেজি উইকিপিডিয়া-এর Leland McInnes | ||
| অন্যান্য সংস্করণ |
|
||
| SVG genesis | এই W3C-অবৈধ ডায়াগ্রামটি Matplotlib দিয়ে তৈরি করা হয়েছে।
Global average temperature, atmospheric CO2, and sunspot activity since 1850. Thick lines for temperature and sunspots represent a 25 year moving average smoothing of the raw data. This figure was produced by Leland McInnes using python and matplotlib and is licensed under the GFDL. All data is from publicly available sources.
| ||
| উৎস কোড | Python code#! /usr/bin/env python3
# -*- coding: utf-8 -*-
import numpy as np
import matplotlib.pylab as plt
import matplotlib.ticker as ticker
import urllib3
import ftplib
import shutil
plt.rcdefaults()
plt.style.use('classic')
def saveurl(url, fname):
if url.startswith("ftp"):
ftp = ftplib.FTP('/'.join(url.split('/')[2:3]))
ftp.login('', '')
with open(fname, 'wb') as f:
res = ftp.retrbinary('RETR %s' % '/'.join(url.split('/')[3:]), f.write)
else:
c = urllib3.PoolManager()
with c.request('GET', url, preload_content=False) as resp, open(fname, 'wb') as out_file:
shutil.copyfileobj(resp, out_file)
print('saved', fname, 'from', url)
def smooth_convolution(signal, window_size):
window_size = 1 + 2 * (window_size // 2) # should be odd
w = np.hamming(window_size)
y = (np.convolve(w, signal) / np.convolve(w, np.ones_like(signal)))
return y[(len(w)-1)//2:-(len(w)//2)]
def smooth_lowess(signal, window_size):
s = window_size // 2
window = np.hamming(1+2*s) / np.hamming(1+2*s).sum()
smoothed = np.empty_like(signal)
for i in range(len(signal)):
i0, i1 = max(i-s, 0), min(i+s, len(signal)-1) + 1
# linear LOWESS smoothing
smoothed[i] = np.poly1d(np.polyfit(np.arange(i0, i1), signal[i0:i1], deg=1,
w=np.sqrt(window[i0-i+s:i1-i+s])))(i)
return smoothed
saveurl("http://woodfortrees.org/data/hadcrut4gl/mean:12", "hadcrut4gl.txt")
with open("hadcrut4gl.txt") as temp_file:
temp_years, temps = [], []
for l in temp_file.readlines():
yT = l.split()
if (not l.startswith('#')) and len(yT) == 2:
temp_years.append(float(yT[0]))
temps.append(float(yT[1]))
#print('T', list(zip(temp_years, temps)))
saveurl("ftp://aftp.cmdl.noaa.gov/products/trends/co2/co2_mm_mlo.txt", "co2_mm_mlo.dat")
with open("co2_mm_mlo.dat") as co2_file:
data_rows = [x.split() for x in co2_file if not x.startswith("#") and x.find("-99.99") == -1]
co2_years = [float(x[2]) for x in data_rows]
co2concs = [float(x[3]) for x in data_rows]
#print('co2', list(zip(co2_years, co2concs)))
saveurl("ftp://ftp.ncdc.noaa.gov/pub/data/paleo/icecore/antarctica/law/law_co2.txt", "law_co2.txt")
with open("law_co2.txt", encoding="ISO-8859-1") as lawco2_file:
data_rows = [x.split() for x in lawco2_file if x.startswith(" 1")]
del data_rows[ [float(x[0]) for x in data_rows].index(1010.):]
lawco2_years = [float(x[0]) for x in data_rows]
lawco2concs = [float(x[-1]) for x in data_rows]
#print('lawco2', list(zip(lawco2_years, lawco2concs)))
saveurl("http://www.sidc.be/silso/DATA/SN_y_tot_V2.0.txt", "yearssn.dat")
with open("yearssn.dat") as sunspot_file:
data_rows = [x.split() for x in sunspot_file if "*" not in x]
sun_years = [float(x[0]) for x in data_rows]
sunspots = [float(x[1]) for x in data_rows]
#print('sunspots', list(zip(sun_years, sunspots)))
t_min, t_max = 1850, max(temp_years[-1], co2_years[-1], sun_years[-1])
smoothed_temps = smooth_lowess(temps, 25 * 12)
smoothed_sunspots = smooth_convolution(sunspots, 25)
rect = [0.125, 0.1, 0.775, 0.8]
base_ax = plt.axes(rect)
base_ax.yaxis.tick_left()
plt.yticks([])
plt.xlim(t_min, t_max)
plt.gca().xaxis.set_major_locator(ticker.MultipleLocator(20))
plt.xlabel("Year", size=16)
plt.title(r"Temperature, CO$_2$, and Sunspots", size=22)
temp_ax = plt.axes([rect[0],rect[1]+.42*rect[3],rect[2],.58*rect[3]], frameon=False)
temp_ax.yaxis.tick_left()
plt.plot(temp_years, temps, '#FF2200')
tline = plt.plot(temp_years, smoothed_temps, '#AA0000', lw=3)
plt.xlim(t_min, t_max)
plt.ylim(min(temps)*1.03 - 0.03*max(temps), max(temps)*1.03 - 0.03*min(temps))
plt.yticks(np.arange(-0.6,0.9,0.2))
plt.ylabel(u'Temperature anomaly (°C)', size=14, color='#AA0000')
plt.xticks([])
co2_ax = plt.axes([rect[0],rect[1]+.25*rect[3],rect[2],.5*rect[3]], frameon=False)
co2_ax.yaxis.tick_right()
co2_ax.yaxis.set_label_position("right")
co2_ax.xaxis.tick_bottom()
plt.plot(co2_years, co2concs, '#44AAFF')
cline = plt.plot(lawco2_years, lawco2concs, '#2288EE', lw=2)
plt.xlim(t_min, t_max)
plt.ylabel(r'CO$_2$ (ppm)', size=14, color='#2288EE')
plt.xticks([])
sun_ax = plt.axes([rect[0],rect[1],rect[2],.5*rect[3]], frameon=False)
sun_ax.yaxis.tick_left()
plt.plot(sun_years, sunspots, "#FFDD00")
sline = plt.plot(sun_years, smoothed_sunspots, "#FF9900", lw=3)
plt.xlim(t_min, t_max)
plt.yticks(np.arange(0,250,50))
plt.ylabel("Sunspot number", size=14, color='#FF9900')
plt.xticks([])
plt.sca(base_ax)
t_proxy = plt.Line2D([0], [0], c='#AA0000', lw=3)
c_proxy = plt.Line2D([0], [0], c='#2288EE', lw=3)
s_proxy = plt.Line2D([0], [0], c='#FF9900', lw=3)
plt.legend((t_proxy, c_proxy, s_proxy), ("Temperature", r"CO$_2$", "Sunspots"), loc="upper left")
plt.savefig("Temp-co2-sunspot.svg")
plt.show()
|


Related Images


লাইসেন্স প্রদান
Leland McInnes ইংরেজি উইকিপিডিয়া থেকে, এই কাজের স্বত্বাধিকারী, এতদ্দ্বারা এই কাজকে নিম্ন বর্ণিত লাইসেন্সের আওতায় প্রকাশিত করেছেন:
| এই ফাইলটি ক্রিয়েটিভ কমন্স অ্যাট্রিবিউশন-শেয়ার অ্যালাইক ৩.০ আনপোর্টেড লাইসেন্সের আওতায় লাইসেন্সকৃত। দাবিত্যাগের সাপেক্ষে। | ||
| স্বীকৃতিপ্রদান: Leland McInnes ইংরেজি উইকিপিডিয়া থেকে | ||
| ||
| এই লাইসেন্স ট্যাগটি জিএফডিএল লাইসেন্স হালনাগাদের অংশ হিসেবে এই ফাইলে সংযুক্ত হয়েছে। |

|
এই নথি অনুলিপি, বিতরণ এবং/বা পরিবর্তন করার অনুমতি ফ্রি সফটওয়্যার ফাউন্ডেশন কর্তৃক প্রকাশিত গনু ফ্রি ডকুমেন্টেশন লাইসেন্স, সংস্করণ ১.২ বা তার পরবর্তী সংস্করণের আওতায় অনুমতিপ্রাপ্ত; যে কোনো রকম অনুচ্ছেদ পরিবর্তন, সম্মুখ-প্রচ্ছদের লেখা, পিছন-প্রচ্ছদের লেখা পরিবর্তন করা ছাড়াই। এই লাইসেন্সের একটি অনুলিপি গনু ফ্রি ডকুমেন্টেশন লাইসেন্স শিরোনামের অনুচ্ছেদে অন্তর্ভুক্ত করা আছে। দাবিত্যাগের সাপেক্ষে। |
মূল আপলোড লগ
মূল বিবরণ পাতাটি এখানে ছিল। নিম্নলিখিত সকল ব্যবহারকারীর নাম en.wikipedia-এ উল্লেখ করা ছিল।
- 2009-01-11 03:45 Leland McInnes 720×540× (102750 bytes)
- 2008-10-09 00:57 Leland McInnes 600×480× (34962 bytes)
- 2007-03-11 02:47 Leland McInnes 600×480× (48910 bytes) Fix for wrong data selection
- 2007-03-11 02:10 Leland McInnes 600×480× (48672 bytes) Update to Had CRUT3 instead of CRUTEM
- 2007-03-10 20:46 Leland McInnes 600×480× (48525 bytes)
- 2007-03-10 20:41 Leland McInnes 600×480× (47761 bytes)
- 2007-03-10 05:01 Leland McInnes 600×480× (33704 bytes) Global average temperature, Mauna Loa CO<sub>2</sub>, and sunspot activity for the last 50 years.
ফাইলের ইতিহাস
যেকোনো তারিখ/সময়ে ক্লিক করে দেখুন ফাইলটি তখন কী অবস্থায় ছিল।
| তারিখ/সময় | সংক্ষেপচিত্র | মাত্রা | ব্যবহারকারী | মন্তব্য | |
|---|---|---|---|---|---|
| বর্তমান | ২০:২৩, ৩০ মে ২০২২ | | ৭২০ × ৫৪০ (৯৮ কিলোবাইট) | Geek3 | update 2022-04 |
| ১৩:১১, ৯ এপ্রিল ২০২১ |  | ৭২০ × ৫৪০ (১০৬ কিলোবাইট) | Geek3 | update 2021-04 | |
| ১৩:০৪, ২৬ জুন ২০২০ |  | ৭২০ × ৫৪০ (১০৫ কিলোবাইট) | Geek3 | data update 2020-05, enlarge temperature y-axis | |
| ১৫:১০, ৬ মার্চ ২০২০ |  | ৭২০ × ৫৪০ (১০৭ কিলোবাইট) | Geek3 | update with 2020 data | |
| ২২:১৫, ২২ জুন ২০১৪ |  | ৭২০ × ৫৪০ (৭৬ কিলোবাইট) | Kopiersperre | switch from hadcrut3 to hadcrut4 | |
| ২০:২৭, ১১ মার্চ ২০১৪ |  | ৭২০ × ৫৪০ (৬২ কিলোবাইট) | Kopiersperre | update | |
| ২১:০৪, ২৫ জুন ২০১২ |  | ৭৩১ × ৫৫১ (৭৫ কিলোবাইট) | Johnanth | New version pulled from file discussion, based on the newly updated Python script. | |
| ১৮:৩৮, ২০ জুন ২০১১ |  | ৭৩১ × ৫৫১ (৬৯ কিলোবাইট) | Killiondude | http://m8y.org/tmp/wikipedia/ Someone was kind enough to use updated stats and redo it. | |
| ১২:১০, ৪ মে ২০০৯ |  | ৭২০ × ৫৪০ (১০০ কিলোবাইট) | File Upload Bot (Magnus Manske) | {{BotMoveToCommons|en.wikipedia|year={{subst:CURRENTYEAR}}|month={{subst:CURRENTMONTHNAME}}|day={{subst:CURRENTDAY}}}} {{Information |Description={{en|__NOTOC__ Global average temperature, atmospheric CO<sub>2</sub>, and sunspot activity since 1850. Thi |
সংযোগসমূহ
নিচের পৃষ্ঠা(গুলো) থেকে এই ছবিতে সংযোগ আছে:
ফাইলের বৈশ্বিক ব্যবহার
নিচের অন্যান্য উইকিগুলো এই ফাইলটি ব্যবহার করে:
- be.wikipedia.org-এ ব্যবহার
- ca.wikipedia.org-এ ব্যবহার
- de.wikipedia.org-এ ব্যবহার
- en.wikipedia.org-এ ব্যবহার
- en.wikiversity.org-এ ব্যবহার
- es.wikipedia.org-এ ব্যবহার
- fa.wikipedia.org-এ ব্যবহার
- fr.wikipedia.org-এ ব্যবহার
- hu.wikipedia.org-এ ব্যবহার
- ig.wikipedia.org-এ ব্যবহার
- it.wikipedia.org-এ ব্যবহার
- ko.wikipedia.org-এ ব্যবহার
- pt.wikipedia.org-এ ব্যবহার
- ru.wikipedia.org-এ ব্যবহার
- sr.wikipedia.org-এ ব্যবহার
- tr.wikipedia.org-এ ব্যবহার
- uk.wikipedia.org-এ ব্যবহার
- zh.wikipedia.org-এ ব্যবহার