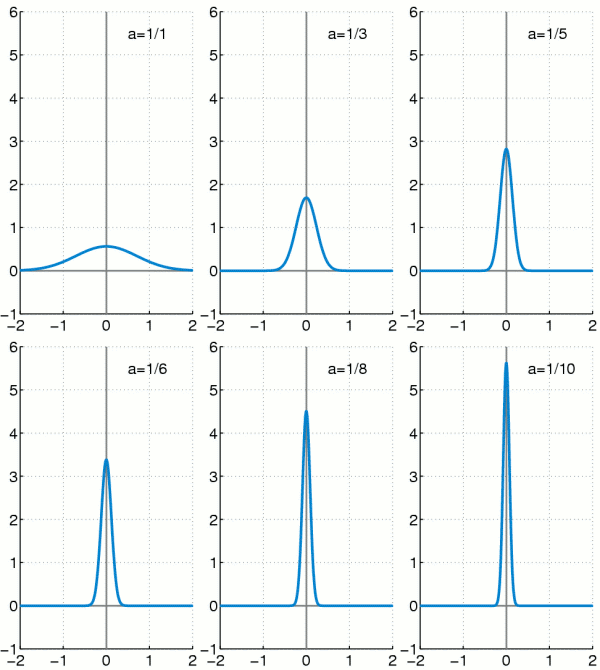
চিত্র:Dirac function approximation.gif
Dirac_function_approximation.gif (২০০ × ৩৩৫ পিক্সেল, ফাইলের আকার: ৮৯ কিলোবাইট, এমআইএমই ধরন: image/gif, লুপকৃত, ১০ ফ্রেম, ২.০ সে)
ফাইলের ইতিহাস
যেকোনো তারিখ/সময়ে ক্লিক করে দেখুন ফাইলটি তখন কী অবস্থায় ছিল।
| তারিখ/সময় | সংক্ষেপচিত্র | মাত্রা | ব্যবহারকারী | মন্তব্য | |
|---|---|---|---|---|---|
| বর্তমান | ২২:৫১, ১২ জানুয়ারি ২০০৮ |  | ২০০ × ৩৩৫ (৮৯ কিলোবাইট) | Oleg Alexandrov | tweak |
| ২২:২২, ১২ জানুয়ারি ২০০৮ |  | ২১৭ × ৩৬৩ (৯৯ কিলোবাইট) | Oleg Alexandrov | {{Information |Description=Illustration of approximating the Dirac delta function by gaussians. |Source=self-made with MATLAB |Date=~~~~~ |Author= Oleg Alexandrov |Permission= |other_versions= }} {{ |
সংযোগসমূহ
নিচের পৃষ্ঠা(গুলো) থেকে এই ছবিতে সংযোগ আছে:
ফাইলের বৈশ্বিক ব্যবহার
নিচের অন্যান্য উইকিগুলো এই ফাইলটি ব্যবহার করে:
- ar.wikipedia.org-এ ব্যবহার
- bg.wikipedia.org-এ ব্যবহার
- cs.wikipedia.org-এ ব্যবহার
- da.wikipedia.org-এ ব্যবহার
- de.wikipedia.org-এ ব্যবহার
- el.wikipedia.org-এ ব্যবহার
- en.wikipedia.org-এ ব্যবহার
- en.wikibooks.org-এ ব্যবহার
- fa.wikipedia.org-এ ব্যবহার
- fi.wikipedia.org-এ ব্যবহার
- fr.wikipedia.org-এ ব্যবহার
- he.wikipedia.org-এ ব্যবহার
- hi.wikipedia.org-এ ব্যবহার
- hu.wikipedia.org-এ ব্যবহার
- id.wikipedia.org-এ ব্যবহার
- it.wikipedia.org-এ ব্যবহার
- ka.wikipedia.org-এ ব্যবহার
- ko.wikipedia.org-এ ব্যবহার
- nl.wikipedia.org-এ ব্যবহার
- no.wikipedia.org-এ ব্যবহার
- pt.wikipedia.org-এ ব্যবহার
- ro.wikipedia.org-এ ব্যবহার
- simple.wikipedia.org-এ ব্যবহার
- si.wikipedia.org-এ ব্যবহার
- sl.wikipedia.org-এ ব্যবহার
- sr.wikipedia.org-এ ব্যবহার
- sv.wikipedia.org-এ ব্যবহার
- uk.wikipedia.org-এ ব্যবহার
- vi.wikipedia.org-এ ব্যবহার
- zh.wikipedia.org-এ ব্যবহার
