চিত্র:07 July - Percent of global area at temperature records - Global warming - NOAA.svg

এই SVG ফাইলের জন্য এই PNG প্রাকদর্শনের আকার: ৮০০ × ৫৬০ পিক্সেল। অন্যান্য আকারসমূহ: ৩২০ × ২২৪ পিক্সেল | ৬৪০ × ৪৪৮ পিক্সেল | ১,০২৪ × ৭১৭ পিক্সেল | ১,২৮০ × ৮৯৬ পিক্সেল | ২,৫৬০ × ১,৭৯২ পিক্সেল | ১,০০০ × ৭০০ পিক্সেল।
পূর্ণ রেজোলিউশন (এসভিজি ফাইল, সাধারণত ১,০০০ × ৭০০ পিক্সেল, ফাইলের আকার: ৫ কিলোবাইট)
| এই ফাইলটি উইকিমিডিয়া কমন্স থেকে নেওয়া। সেখানের বর্ণনা পাতার বিস্তারিত নিম্নে দেখানো হলো। (সম্পাদনা)
|
সারাংশ
| বিবরণ |
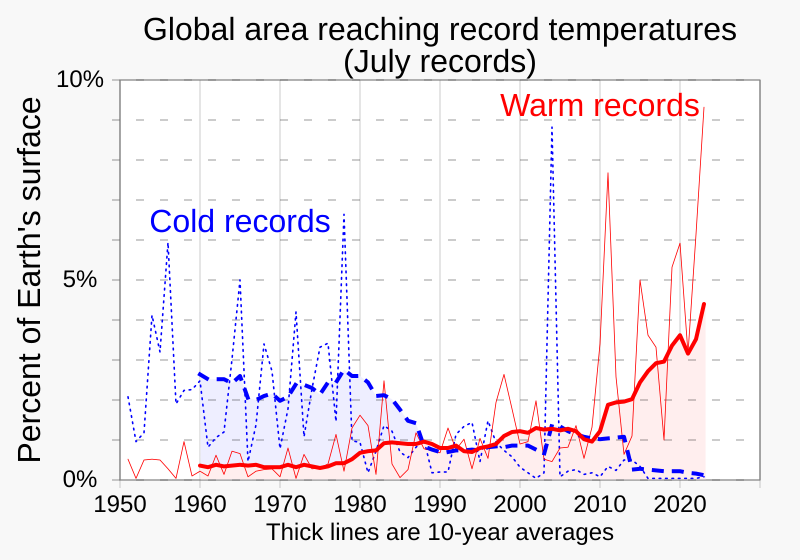
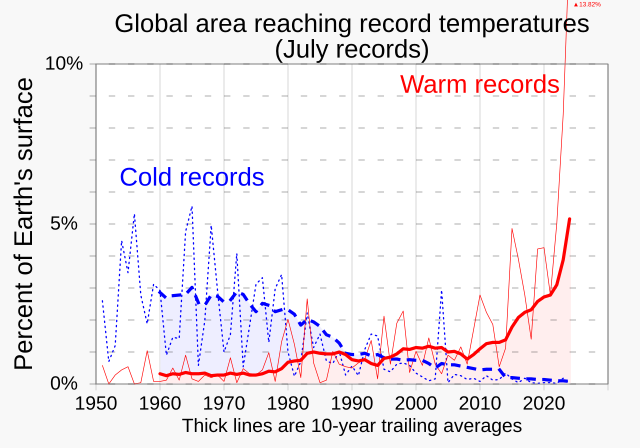
English: Line graphs of the percentages of Earth's surface reaching a record July temperature as a function of time over years 1951-, from NOAA data.
|
||
| তারিখ | |||
| উৎস | নিজের কাজ | ||
| লেখক | RCraig09 |

Related files
-
 01 January - Percent of global area at temperature records - Global warming - NOAA.svg
(January data) -
 02 February - Percent of global area at temperature records - Global warming - NOAA.svg
(February data) -
 03 March - Percent of global area at temperature records - Global warming - NOAA.svg
(March data) -
 04 April - Percent of global area at temperature records - Global warming - NOAA.svg
(April data) -
 05 May - Percent of global area at temperature records - Global warming - NOAA.svg
(May data) -
 06 June - Percent of global area at temperature records - Global warming - NOAA.svg
(June data)


-
 07 July - Percent of global area at temperature records - Global warming - NOAA.svg
(July data) -
 08 August - Percent of global area at temperature records - Global warming - NOAA.svg
(August data) -
 09 September - Percent of global area at temperature records - Global warming - NOAA.svg
(September data) -
 10 October - Percent of global area at temperature records - Global warming - NOAA.svg
(October data) -
 11 November - Percent of global area at temperature records - Global warming - NOAA.svg
(November data) -
 12 December - Percent of global area at temperature records - Global warming - NOAA.svg
(December data)


-
 1951+ Percent of global area at temperature records - Seasonal comparison - NOAA.svg
Seasonal comparison -
 1951 - Percent of global area at temperature records (monthly) - Global warming - NOAA.svg
All months scatterplot/dot plot -
 1951- RATIO of new record warm temperatures to new record cold temperatures (monthly) - Global warming.svg
Ratios scatterplot/dot plot (monthly) -
 1951- Percent of record temperatures that are cold or warm records.svg
 -
 1951- Warm and cold record temperatures - bar chart.svg

_-_Global_warming_-_NOAA.svg)
_-_Global_warming.svg)


লাইসেন্স প্রদান
আমি, এই কাজের স্বত্বাধিকারী, এতদ্দ্বারা আমি এই কাজকে নিম্ন বর্ণিত লাইসেন্সের আওতায় প্রকাশ করলাম:
এই ফাইলটি ক্রিয়েটিভ কমন্স অ্যাট্রিবিউশন-শেয়ার অ্যালাইক ৪.০ আন্তর্জাতিক লাইসেন্সের আওতায় লাইসেন্সকৃত।
- আপনি স্বাধীনভাবে:
- বণ্টন করতে পারেন – এ কাজটি অনুলিপি, বিতরণ এবং প্রেরণ করতে পারেন
- পুনঃমিশ্রণ করতে পারেন – কাজটি অভিযোজন করতে পারেন
- নিম্নের শর্তাবলীর ভিত্তিতে:
- স্বীকৃতিপ্রদান – আপনাকে অবশ্যই যথাযথ স্বীকৃতি প্রদান করতে হবে, লাইসেন্সের একটি লিঙ্ক সরবরাহ করতে হবে এবং কোনো পরিবর্তন হয়েছে কিনা তা নির্দেশ করতে হবে। আপনি যেকোনো যুক্তিসঙ্গত পদ্ধতিতে এটি করতে পারেন। কিন্তু এমন ভাবে নয়, যাতে প্রকাশ পায় যে লাইসেন্সধারী আপনাকে বা আপনার এই ব্যবহারের জন্য অনুমোদন দিয়েছে।
- একইভাবে বণ্টন – আপনি যদি কাজটি পুনঃমিশ্রণ, রুপান্তর, বা এর ওপর ভিত্তি করে নতুন সৃষ্টিকর্ম তৈরি করেন, তবে আপনাকে অবশ্যই আপনার অবদান একই লাইসেন্স বা একই রকমের লাইসেন্সের আওতায় বিতরণ করতে হবে।
ফাইলের ইতিহাস
যেকোনো তারিখ/সময়ে ক্লিক করে দেখুন ফাইলটি তখন কী অবস্থায় ছিল।
| তারিখ/সময় | সংক্ষেপচিত্র | মাত্রা | ব্যবহারকারী | মন্তব্য | |
|---|---|---|---|---|---|
| বর্তমান | ০৩:৪২, ১৫ আগস্ট ২০২৩ | | ১,০০০ × ৭০০ (৫ কিলোবাইট) | RCraig09 | Version 20: update to include data through July 2023 |
| ০৩:৫৪, ২৯ জুলাই ২০২৩ |  | ১,০০০ × ৭০০ (৭ কিলোবাইট) | RCraig09 | Version 9: centering some text strings . . . making "(July records)" more conspicuous | |
| ১৫:১৮, ২৮ জুলাই ২০২৩ |  | ১,০০০ × ৭০০ (৭ কিলোবাইট) | RCraig09 | Version 8: created new graphic for JULY figures.... but only through July 2021 . . . I plan to update when July 2023 data becomes available | |
| ১৬:৪৭, ১৫ জুন ২০২৩ |  | ১,০০০ × ৭০০ (৯ কিলোবাইট) | RCraig09 | Version 7: arrange order of code to make horizontal gridlines appear in front of colored areas | |
| ২২:০৯, ২৫ মে ২০২৩ |  | ১,০০০ × ৭০০ (৯ কিলোবাইট) | RCraig09 | Version 6: Add blue fill area . . . . simplify horizontal axis | |
| ১৫:৫০, ২৫ মে ২০২৩ |  | ১,০০০ × ৭৫০ (৯ কিলোবাইট) | RCraig09 | Version 5: changed dark blue line to dashed line . . . . making read fill-area be under 10-year average (rather than under annual numbers which are not as smooth a trace) | |
| ০৫:১৫, ২৫ মে ২০২৩ |  | ১,০০০ × ৭৫০ (৯ কিলোবাইট) | RCraig09 | Version 4: Add 10-year moving averages traces | |
| ১৮:৫০, ২৪ মে ২০২৩ |  | ১,০০০ × ৭৫০ (৬ কিলোবাইট) | RCraig09 | Version 3: update to include data through April 2023 . . . . add shading under red trace | |
| ১৯:৩১, ২ সেপ্টেম্বর ২০২১ |  | ১,০০০ × ৭৫০ (৫ কিলোবাইট) | RCraig09 | Version 2: Amending title to be more descriptive | |
| ১৯:০৬, ২ সেপ্টেম্বর ২০২১ |  | ১,০০০ × ৭৫০ (৫ কিলোবাইট) | RCraig09 | Uploaded own work with UploadWizard |
সংযোগসমূহ
নিচের পৃষ্ঠা(গুলো) থেকে এই ছবিতে সংযোগ আছে:
ফাইলের বৈশ্বিক ব্যবহার
নিচের অন্যান্য উইকিগুলো এই ফাইলটি ব্যবহার করে:
- en.wikipedia.org-এ ব্যবহার
- es.wikipedia.org-এ ব্যবহার
- fa.wikipedia.org-এ ব্যবহার
- ja.wikipedia.org-এ ব্যবহার
- no.wikipedia.org-এ ব্যবহার
- tr.wikipedia.org-এ ব্যবহার