চিত্র:Energy through phase changes.png

এই প্রাকদর্শনের আকার: ৮০০ × ৫১৭ পিক্সেল। অন্যান্য আকারসমূহ: ৩২০ × ২০৭ পিক্সেল | ৬৪০ × ৪১৩ পিক্সেল | ৯৬০ × ৬২০ পিক্সেল।
পূর্ণ রেজোলিউশন (৯৬০ × ৬২০ পিক্সেল, ফাইলের আকার: ১০৭ কিলোবাইট, এমআইএমই ধরন: image/png)
| এই ফাইলটি উইকিমিডিয়া কমন্স থেকে নেওয়া। সেখানের বর্ণনা পাতার বিস্তারিত নিম্নে দেখানো হলো। (সম্পাদনা)
|
সারাংশ
| বিবরণ |
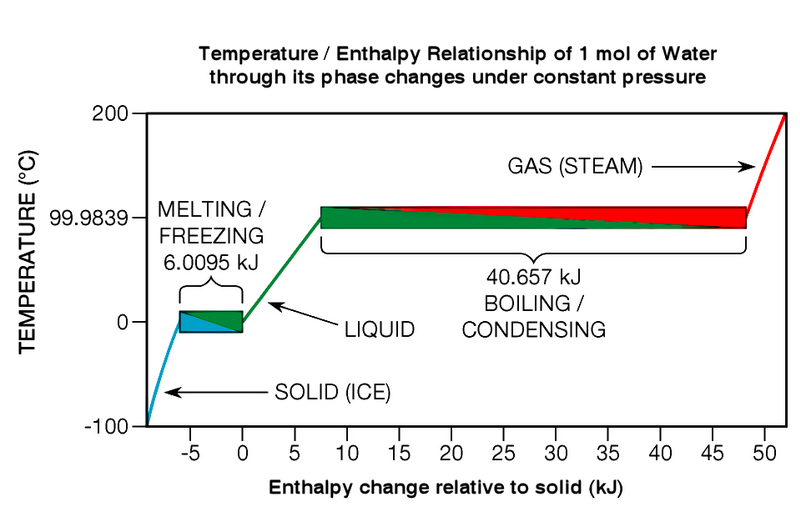
English: Temperature Enthaply relationship of 1 mol of water through its phase changes under constant pressure. This graph shows that the temperature of a water sample does not change during phase transitions as heat flows in or out of it. The total heat capacity of a mole of water in its liquid phase (the green line) is 7.5507 kJ. |
| তারিখ | ২০ জুলাই ২০০৬T00:16:56Z |
| উৎস | নিজের কাজ |
| লেখক | Greg L |
| অন্যান্য সংস্করণ |


|
This diagram image could be re-created using vector graphics as an SVG file. This has several advantages; see Commons:Media for cleanup for more information. If an SVG form of this image is available, please upload it and afterwards replace this template with
{{vector version available|new image name}}.
It is recommended to name the SVG file “Energy through phase changes.svg”—then the template Vector version available (or Vva) does not need the new image name parameter. |
লাইসেন্স প্রদান
Greg L ইংরেজি উইকিপিডিয়া থেকে, এই কাজের স্বত্বাধিকারী, এতদ্দ্বারা এই কাজকে নিম্ন বর্ণিত লাইসেন্সের আওতায় প্রকাশিত করেছেন:
| এই ফাইলটি ক্রিয়েটিভ কমন্স অ্যাট্রিবিউশন-শেয়ার অ্যালাইক ৩.০ আনপোর্টেড লাইসেন্সের আওতায় লাইসেন্সকৃত। দাবিত্যাগের সাপেক্ষে। | ||
| স্বীকৃতিপ্রদান: Greg L ইংরেজি উইকিপিডিয়া থেকে | ||
| ||
| এই লাইসেন্স ট্যাগটি জিএফডিএল লাইসেন্স হালনাগাদের অংশ হিসেবে এই ফাইলে সংযুক্ত হয়েছে। |

|
এই নথি অনুলিপি, বিতরণ এবং/বা পরিবর্তন করার অনুমতি ফ্রি সফটওয়্যার ফাউন্ডেশন কর্তৃক প্রকাশিত গনু ফ্রি ডকুমেন্টেশন লাইসেন্স, সংস্করণ ১.২ বা তার পরবর্তী সংস্করণের আওতায় অনুমতিপ্রাপ্ত; যে কোনো রকম অনুচ্ছেদ পরিবর্তন, সম্মুখ-প্রচ্ছদের লেখা, পিছন-প্রচ্ছদের লেখা পরিবর্তন করা ছাড়াই। এই লাইসেন্সের একটি অনুলিপি গনু ফ্রি ডকুমেন্টেশন লাইসেন্স শিরোনামের অনুচ্ছেদে অন্তর্ভুক্ত করা আছে। দাবিত্যাগের সাপেক্ষে। |

|
এই ফাইলটি বিষয়শ্রেণীবিহীন।
দয়া করে এক বা একাধিক বিষয়শ্রেণী যোগ করে এই ফাইলটি উন্নতিতে সাহায্য করুন, যাতে এটি সম্পর্কিত ফাইলসমূহ-এর সাথে যোগ হতে পারে (কীভাবে?), এবং তাহলে এটি আরো সহজে খুঁজে পাওয়া যাবে।
দয়া করে এটি দিয়ে আপলোডকারীকে অবহিত করুন {{subst:Please link images|File:Energy through phase changes.png}} ~~~~ |
ফাইলের ইতিহাস
যেকোনো তারিখ/সময়ে ক্লিক করে দেখুন ফাইলটি তখন কী অবস্থায় ছিল।
| তারিখ/সময় | সংক্ষেপচিত্র | মাত্রা | ব্যবহারকারী | মন্তব্য | |
|---|---|---|---|---|---|
| বর্তমান | ২২:০৪, ৭ এপ্রিল ২০২১ | | ৯৬০ × ৬২০ (১০৭ কিলোবাইট) | JohnVanVliet | jpg artifact removal |
| ২২:১৩, ২৩ সেপ্টেম্বর ২০১০ |  | ৯৬০ × ৬২০ (১০৫ কিলোবাইট) | Kbrose | Graphic correction of image (graph labels). | |
| ১৮:৩৩, ২১ জুলাই ২০০৮ |  | ৯৬০ × ৬২০ (১১১ কিলোবাইট) | 718 Bot | == Summary == This graph shows how water’s temperature does not change during phase transitions as heat energy flows in or out of it.<br><br>By Greg L 00:16, 20 July 2006 (UTC) == Licensing == {{GFDL-self-with-disclaimers}} {{artifact |
সংযোগসমূহ
নিচের পৃষ্ঠা(গুলো) থেকে এই ছবিতে সংযোগ আছে:
ফাইলের বৈশ্বিক ব্যবহার
নিচের অন্যান্য উইকিগুলো এই ফাইলটি ব্যবহার করে:
- en.wikipedia.org-এ ব্যবহার
- zh.wikipedia.org-এ ব্যবহার