চিত্র:CoViD-19 KR.svg

পূর্ণ রেজোলিউশন (এসভিজি ফাইল, সাধারণত ৭০২ × ৫২৪ পিক্সেল, ফাইলের আকার: ৭৭ কিলোবাইট)
| এই ফাইলটি উইকিমিডিয়া কমন্স থেকে নেওয়া। সেখানের বর্ণনা পাতার বিস্তারিত নিম্নে দেখানো হলো। (সম্পাদনা)
|
সারাংশ
| বিবরণ | |
| তারিখ | |
| উৎস | নিজের কাজ |
| লেখক | Micheletb |
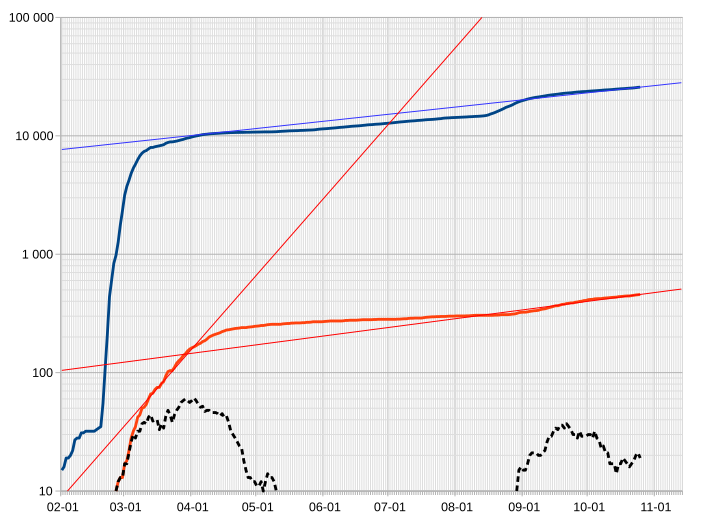
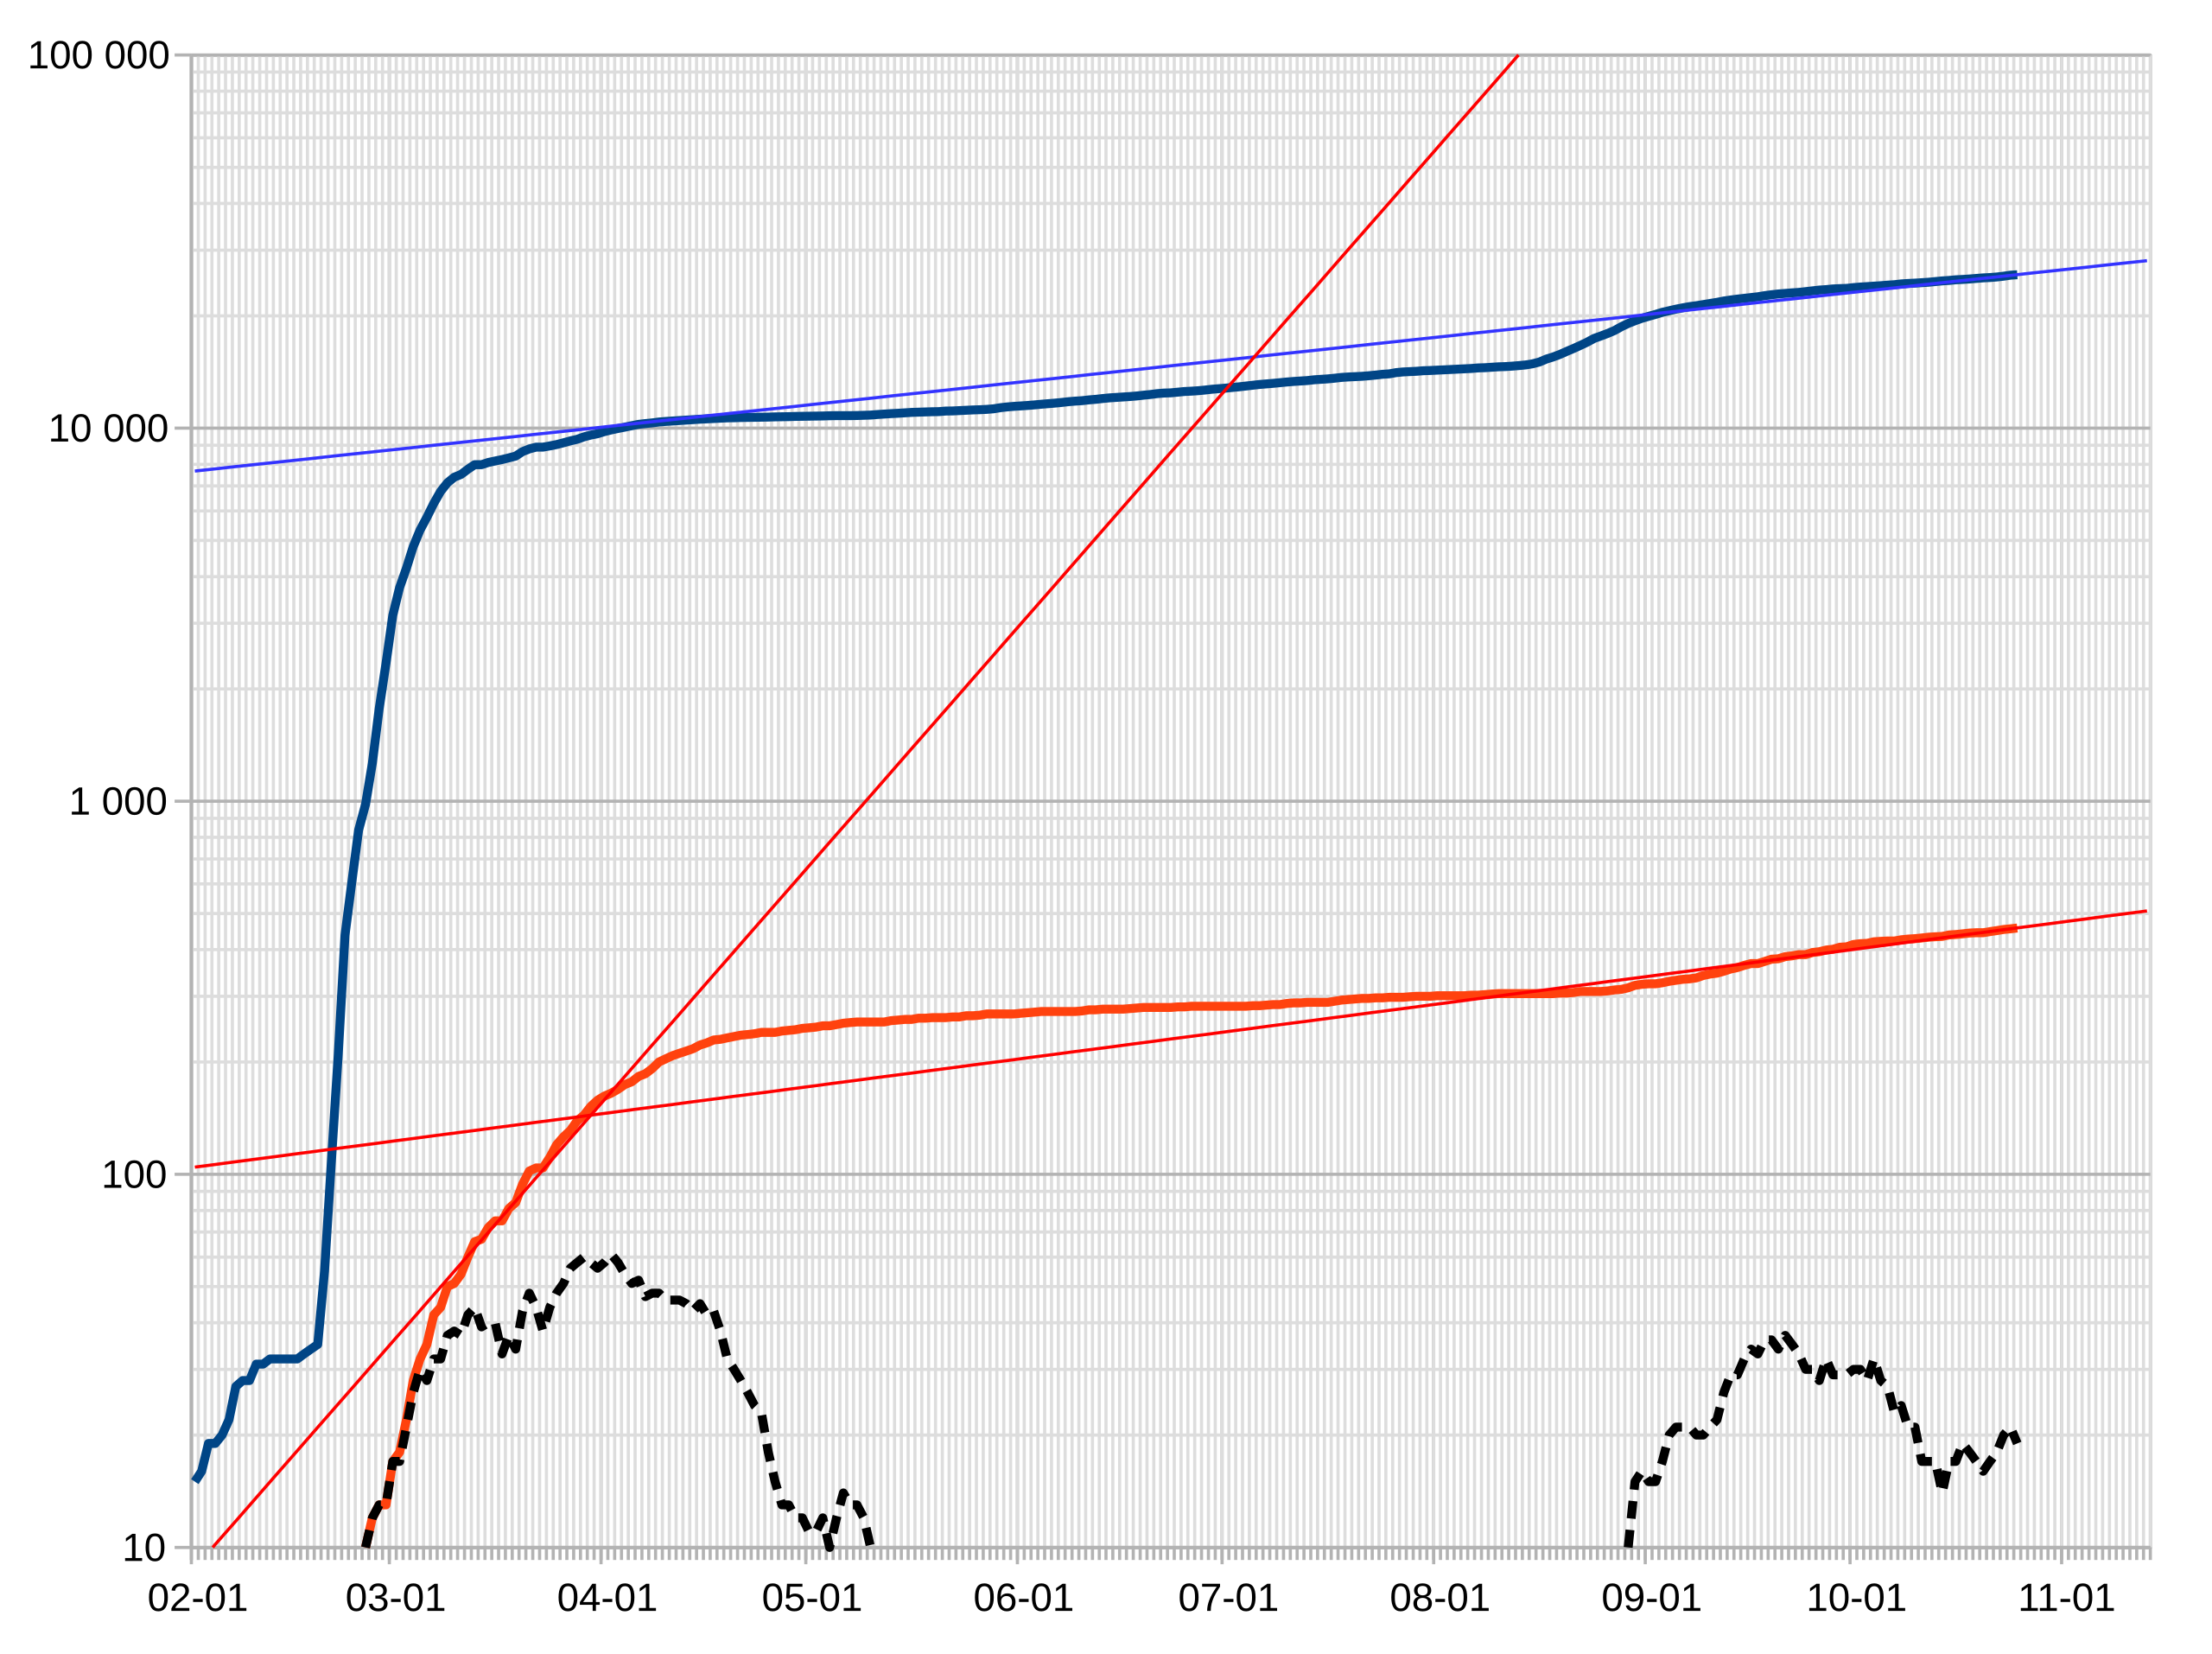
Total confirmed cases (blue), total deaths (red), and reported deaths on the last ten days (dotted black).
This chart has been made using the WHO daily reports (see https://www.who.int/emergencies/diseases/novel-coronavirus-2019/situation-reports/). Though countries are committed to report to WHO every day, some country reports are missing, leading to "steps" in the curve. This is caused by messy report and can't really be corrected. Please note that due to time zones and time of report, the figure for a given day according to WHO may not be that of official sources.
The growth of a pandemic in its initial stage is exponential, meaning that the percentage of increase from one day to another is (roughly) constant. This, in turn, means that in a semi-logarithmic plot, the slope is (roughly) constant, therefore the curve is (roughly) a straight segment. In the end of a pandemic, no additional victims are reported, and the curve is a flat horizontal. In between, the public health policy is to bend the curve down. A change in the policy or its efficiency leads to a change in the slope.
To describe the pandemic's evolution, a daily report of victims or deaths is not really informative in the aftermath. The relevant description is, where are the slope changes, which indicate a change in the pandemic's regime? Those inflection points are the limits within which the description of what has occurred can be homogeneous. Most countries start with very weakly sloped curve, almost horizontal, with few SARS-CoV-2-positive patients : that is the contained stage. Then the curve rises all of a sudden, this is the local starting point of the pandemic, the virus has escaped in the wild and is not contained in the hospital any more. Some weeks later the semilog curve has a first inflection point, this is the effect of measures taken at the end of the "wild" phase, which slows the growth regime. There may be some more regime changes before the curve bends downwards towards very low values, which is more or less the (local) end of the pandemic.
Those intervals, where the curve is (roughly) a straight segment, are best seen when they are illustrated by a reference thin straight line. This "best fit" line is a standard statistical function of the data; and if the segment is straight enough, the choice of starting and ending point for the segment makes little difference. Even when the curve does slope downwards and no straight segment can be identified, a straight reference line that underlines the tangent at a point is useful in judging the curvature itself, though the tangent point is of course arbitrary in that case.
Please do not use these "best fit" lines for extrapolation : the mathematics of epidemics involves many different effects and the modelling needs to take into account many different uncertainties. Whatever the slope of the curve is at a given time, it will eventually curve down (switch to a horizontal). In the case of the COVID-19 pandemic, the values may increase again with repeated peaks over the 12-18 months until vaccines are judged to be safe and are mass-produced and provided to the world's population.
লাইসেন্স প্রদান
- আপনি স্বাধীনভাবে:
- বণ্টন করতে পারেন – এ কাজটি অনুলিপি, বিতরণ এবং প্রেরণ করতে পারেন
- পুনঃমিশ্রণ করতে পারেন – কাজটি অভিযোজন করতে পারেন
- নিম্নের শর্তাবলীর ভিত্তিতে:
- স্বীকৃতিপ্রদান – আপনাকে অবশ্যই যথাযথ স্বীকৃতি প্রদান করতে হবে, লাইসেন্সের একটি লিঙ্ক সরবরাহ করতে হবে এবং কোনো পরিবর্তন হয়েছে কিনা তা নির্দেশ করতে হবে। আপনি যেকোনো যুক্তিসঙ্গত পদ্ধতিতে এটি করতে পারেন। কিন্তু এমন ভাবে নয়, যাতে প্রকাশ পায় যে লাইসেন্সধারী আপনাকে বা আপনার এই ব্যবহারের জন্য অনুমোদন দিয়েছে।
- একইভাবে বণ্টন – আপনি যদি কাজটি পুনঃমিশ্রণ, রুপান্তর, বা এর ওপর ভিত্তি করে নতুন সৃষ্টিকর্ম তৈরি করেন, তবে আপনাকে অবশ্যই আপনার অবদান একই লাইসেন্স বা একই রকমের লাইসেন্সের আওতায় বিতরণ করতে হবে।
ফাইলের ইতিহাস
যেকোনো তারিখ/সময়ে ক্লিক করে দেখুন ফাইলটি তখন কী অবস্থায় ছিল।
| তারিখ/সময় | সংক্ষেপচিত্র | মাত্রা | ব্যবহারকারী | মন্তব্য | |
|---|---|---|---|---|---|
| বর্তমান | ১৭:৪৮, ২ নভেম্বর ২০২০ | | ৭০২ × ৫২৪ (৭৭ কিলোবাইট) | Micheletb | |
| ০৬:৫৮, ১২ অক্টোবর ২০২০ |  | ৭০২ × ৫২৪ (৭১ কিলোবাইট) | Micheletb | ||
| ০৭:১৫, ১ অক্টোবর ২০২০ |  | ৭০২ × ৫২৪ (৬৭ কিলোবাইট) | Micheletb | ||
| ০৭:২১, ২৪ সেপ্টেম্বর ২০২০ |  | ৭০২ × ৫২৪ (৬৭ কিলোবাইট) | Micheletb | ||
| ০৯:১৪, ২৪ জুন ২০২০ |  | ৭০৫ × ৫২৮ (৪১ কিলোবাইট) | Micheletb | ||
| ০৮:২৪, ১৫ জুন ২০২০ |  | ৭০৫ × ৫২৮ (৪৩ কিলোবাইট) | Micheletb | ||
| ০৬:১৯, ৯ জুন ২০২০ |  | ৭০৫ × ৫২৮ (৪৩ কিলোবাইট) | Micheletb | ||
| ০৮:২৫, ৩ জুন ২০২০ |  | ৭০৫ × ৫২৮ (৪৩ কিলোবাইট) | Micheletb | ||
| ০৭:৪৯, ২৯ মে ২০২০ |  | ৭০৫ × ৫২৮ (৪৩ কিলোবাইট) | Micheletb | ||
| ০৭:৫২, ২৫ মে ২০২০ |  | ৭০৫ × ৫২৮ (৪৩ কিলোবাইট) | Micheletb |
সংযোগসমূহ
নিচের পৃষ্ঠা(গুলো) থেকে এই ছবিতে সংযোগ আছে:
ফাইলের বৈশ্বিক ব্যবহার
নিচের অন্যান্য উইকিগুলো এই ফাইলটি ব্যবহার করে:
- en.wikipedia.org-এ ব্যবহার
- fr.wikipedia.org-এ ব্যবহার
- he.wikipedia.org-এ ব্যবহার